

Love staring at a map and discovering something interesting? Then “Mapping the Great Lakes” is for you. It’s a monthly Great Lakes Now feature created by Alex B. Hill, a self-described “data nerd and anthropologist” who combines cartography, data, and analytics with storytelling and human experience. He’s the founder of DETROITography and authored “Detroit in 50 Maps,” a book published in 2021. Find all his Great Lakes Now work HERE.
Many Great Lakes ports saw major increases in demand and cargo volume as the pandemic stressed supply chains. Massive backups at the ports across the world delayed deliveries and increased the cost of storage and shipping containers.
In the United States, for example, the Port of Savannah, Georgia became congested with 35 or more ships waiting to unload cargo, and at the Port of Los Angeles, it was upwards of 60 waiting ships at certain times.
Many companies chose to reroute their supplies to ports across the Great Lakes region, which meant increased traffic on these freshwater routes. The 2021 shipping season saw 38 metric tons come through the St. Lawrence seaway and a 72% increase in general cargo shipments compared to 2020.
The Great Lakes shipping industry was already a powerhouse generating $35 billion in economic activity and 200,000 jobs. Great Lakes ships are tracked and photographed regularly to the point where there are Twitter and Instagram followings for specific ships.
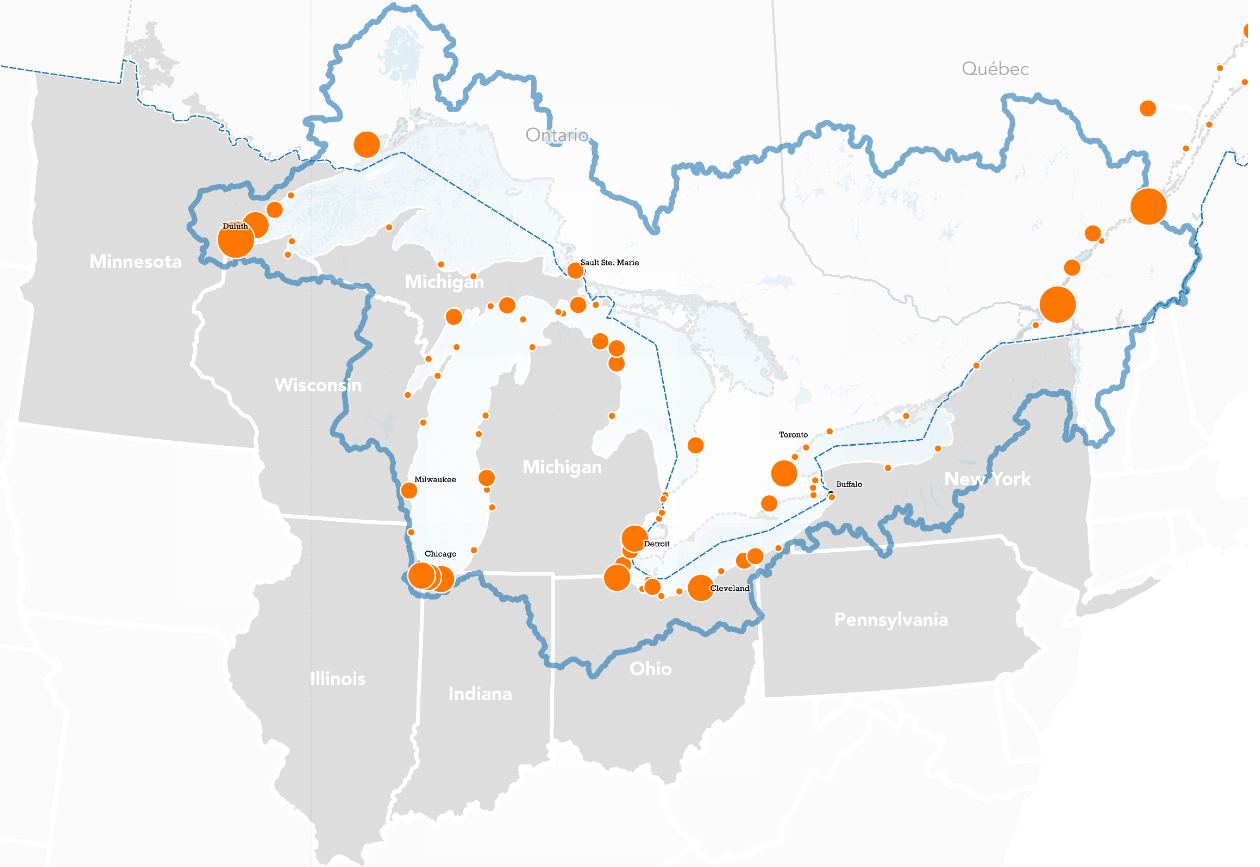
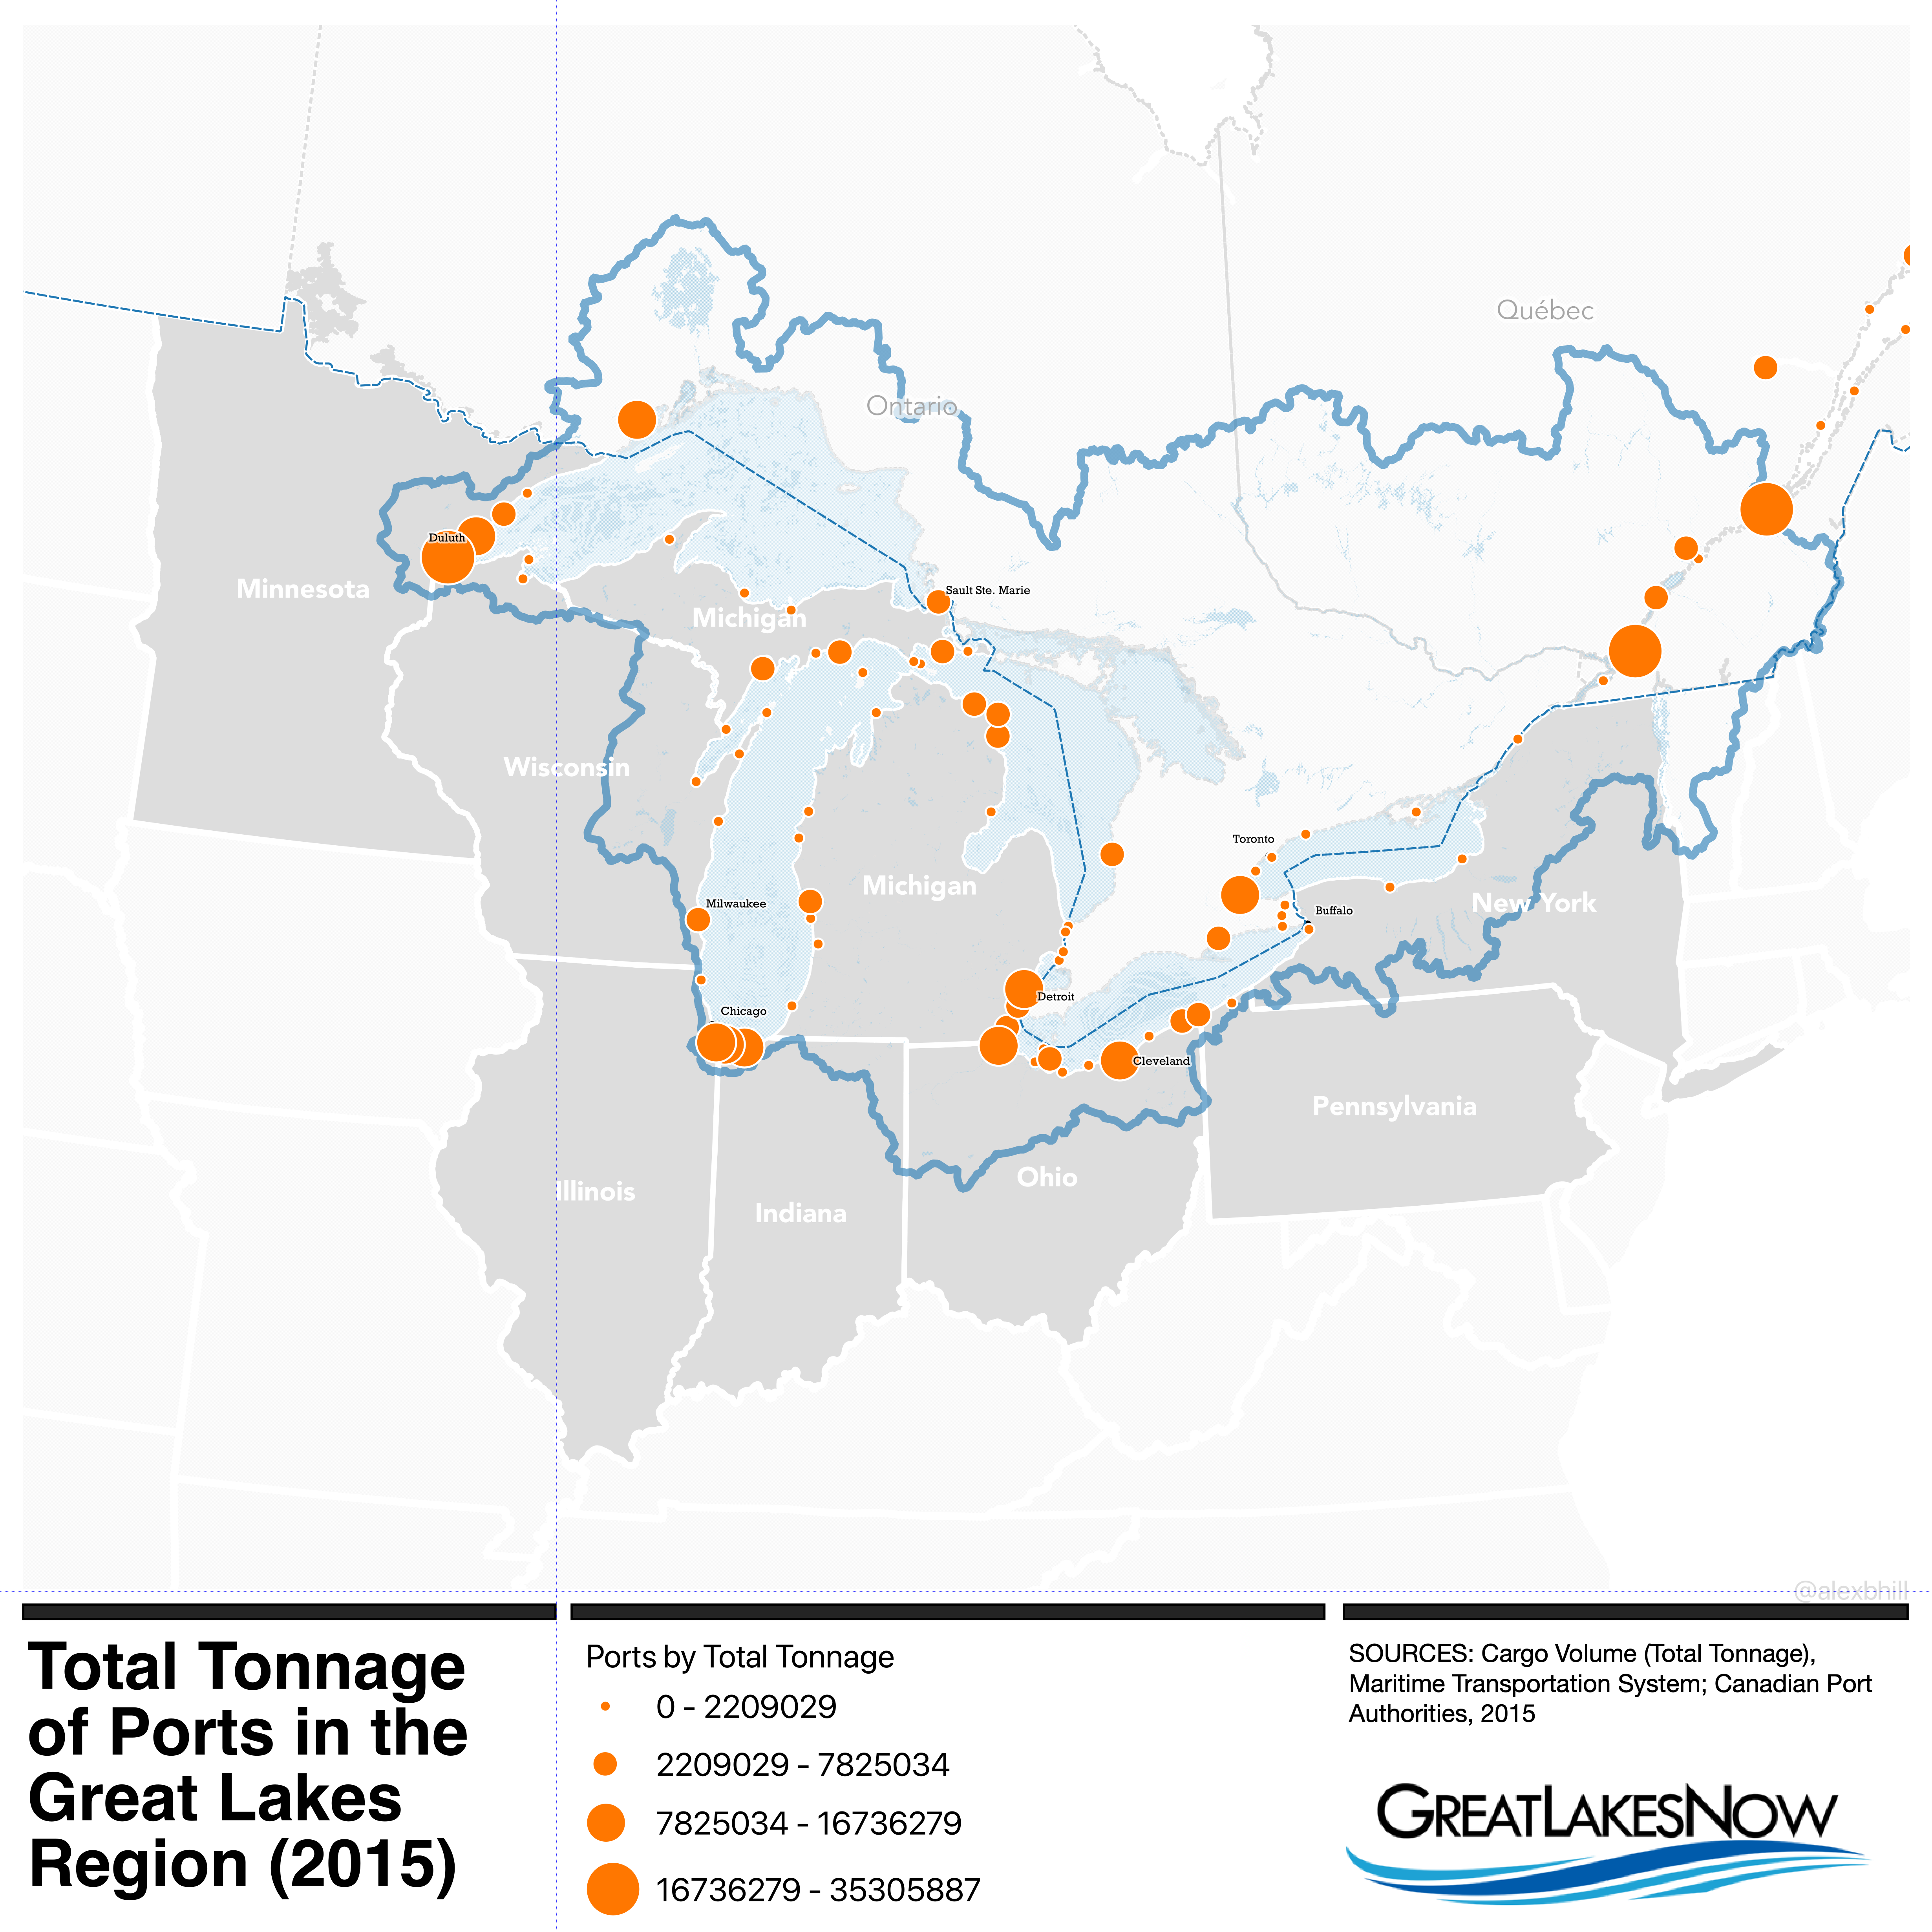
The lake freighters traversing the Great Lakes are often carrying iron ore, limestone, grain, or salt rather than cargo containers, although that is changing. The ports of Duluth, Montreal, and Quebec are some of the largest by cargo volume with Chicago, Cleveland, Hamilton, and Thunder Bay in a close second tier.
The data unfortunately have not kept up with the popularity and opportunity presented in the last few years. In December 2021, the Federal Maritime Commission kicked off a new data initiative to improve data collection and identify gaps.
The data presented in this map are from 2015 and the cargo volume by port had to be gathered from at least four separate sources, including the US Army Corps of Engineers and the Maritime Information System.