
By Kathiann M. Kowalski, Energy News Network
This story was first published on the Energy News Network and was republished here with permission.
Ohio cities are using new data mapping tools to identify and respond to disparities in energy burdens, climate risks, and pollution impacts.
Government and community groups in Cleveland, Columbus and Cincinnati have recently used one particularly robust tool called the Greenlink Equity Map, or GEM, platform. Its maps let users see the intersections among roughly three dozen demographic, economic and environmental factors.
As a result, people can see where folks are most impacted by trouble paying utility bills, asthma cases, evictions and other factors that disproportionately affect people of color and worsen their risks for harm from climate change.
Those issues are especially timely as local areas seek federal infrastructure funds, said Jellie Duckworth, GEM strategic development manager at Greenlink Analytics in Atlanta, which developed the tool.
The Greenlink Equity Map lets cities and community groups say, “This is why you need to put the money here for the infrastructure if you’re going to make a just and equitable transition to clean energy,” Duckworth explained. The organization has compiled data for more than 60 cities so far.
“All this data gives us insight into what these households are experiencing in the census tracts,” said Sharanya Madhavan, a data scientist at Greenlink Analytics. Much of the data comes from U.S. Census databases, as well as the Centers for Disease Control and Prevention and other sources.
The tool “ends up being this one-stop shop where people can come in and see all of these different indicators in one place,” Madhavan said. “They can come in here, look at everything, overlay them and really understand the intersection of all these different aspects that are going on in the city.”
The group plans to add more indicators as data becomes available, Madhavan said. Examples include data on historic redlining, tree cover and heat islands.

What Ohio maps show
In one series of reports, Greenlink Analytics examined the energy burdens for 25 U.S. cities, including Columbus and Cincinnati. The measure compares the median of households’ combined average electricity and gas bills in an area to that area’s median income.
Disparities between the least burdened and most burdened fifth of census tracts in each city showed stark differences. As of 2019, households in Cincinnati’s least-burdened tracts paid an average of just 2.8% of their median income for electricity and gas, compared to 9.7% for households in the most burdened tracts. Residents of Columbus’s least burdened tracts spent an average of just 2.1% of their income on gas and electricity, versus 7.1% for people in the most burdened tracts.
A large number of census tracts in both Cincinnati and Columbus ranked in the top third for energy burdens and asthma rates. A significant number of census tracts in both cities also rank in the top third for energy burdens and evictions. Advocates have noted that utility shutoffs for lack of payment can precipitate evictions.
Cincinnati’s Office of Environment and Sustainability has used the GEM map and other data tools for its work for reducing energy burdens. The majority of low-income weatherization work under existing programs in Ohio has been for single-family homes, said Director Michael Forrester. To avoid duplication, the city is focusing on multifamily dwellings.
The Greenlink Equity Map showed census tracts where people in multifamily homes might particularly profit from energy efficiency programs. Additional work and data review have been necessary, however, to identify properties within tracts where owners and renters might especially benefit, Forrester said. His office is working on ways to make that process more efficient.
Meanwhile, the Cincinnati program aims to help both building owners and tenants, Forrester said. For example, a grant can help owners make weatherization improvements. Other aid can help tenants replace outdated appliances with energy-efficient models and pay off energy bills that have been piling up. Arrears can prevent people with low incomes from getting back on percentage-of-income payment programs.
The GEM mapping platform also highlights how different health, economic, and environmental indicators relate to each other.
“All of these build upon one another to really highlight the vulnerability of neighborhoods and residents,” especially when it comes to climate change, Forrester said. People can see how different areas will be impacted and what factors contribute to their vulnerability.
“In a changing climate, we’re going to have severe disproportionate impacts,” Petersen said. “Climate change does not impact everyone equally.”
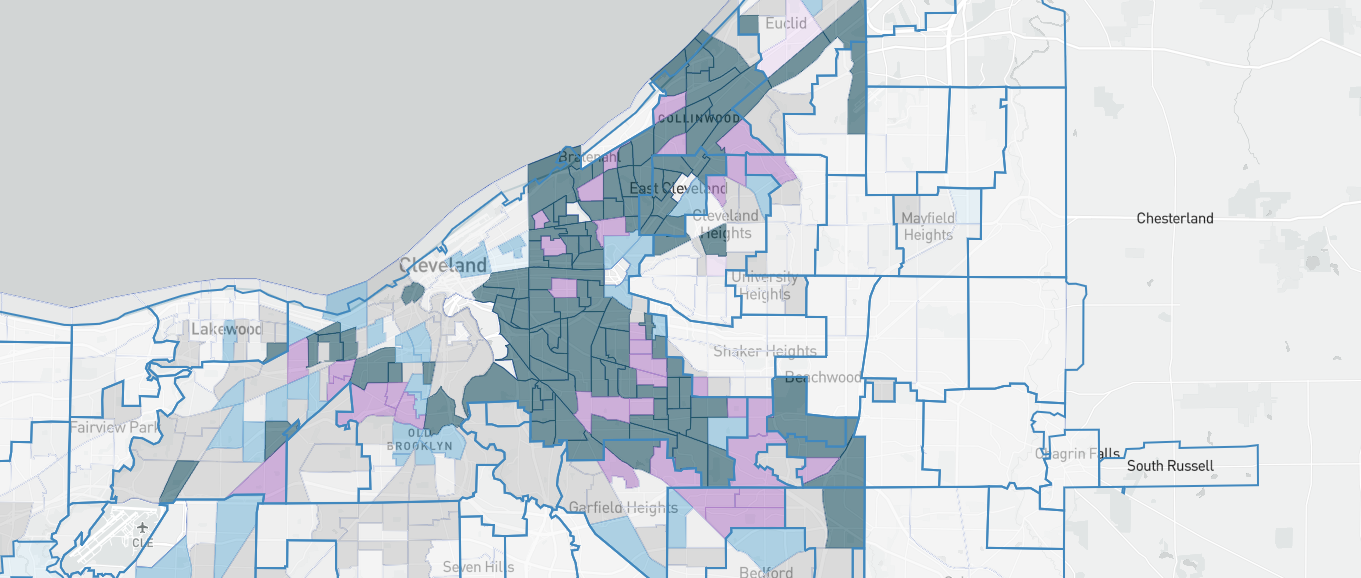
In Cleveland, the Greenlink Equity Map proved helpful for a grant application to deal with asthma problems, said Divya Sridhar, manager of climate resiliency and sustainability at Cleveland Neighborhood Progress. Areas with high asthma rates overlap with places that have high energy burdens. Many households there can’t afford to buy air conditioners or pay to run them when outdoor temperatures are high and air quality is poor. The grant application is pending at the U.S. Environmental Protection Agency.
Down the road, the maps may help neighborhood groups and government planners determine where to put community solar projects and where to target other programs to reduce energy burdens, Sridhar said. So far conversations are just in the early stages, she said, but the tool helps to get those talks started.

Racial disparities
Racial justice is a big goal for Greenlink. For the greater Cleveland area, roughly 80 census tracts fall into the top third for both high energy burden and Black population, noted CEO Matt Cox at Greenlink Analytics. In contrast, just five census tracts fall into the top third for both high energy burden and percentage of White people.
The GEM platform is one of several equity-focused mapping tools that have emerged in recent years and aim to combine multiple data sets. The Environmental Protection Agency’s EJScreen Tool includes information on pollution, heart disease, asthma, climate change risks, critical service gaps such as food deserts, and more. It also shows high concentrations of people of color, but it doesn’t distinguish among groups.
The White House Council on Environmental Quality also released a Climate and Economic Justice Screening Tool for comment in February. Its maps don’t expressly include racial data, however.
“You can’t talk about equity without starting at race,” Madhavan at Greenlink said. “That is really crucial, because without that we’re still looking with an inequality lens and not an equity lens.”
Pollution from power plants, higher energy burdens and other environmental justice issues have long been problems for communities of color, with multiple systemic factors driving the disparities. And neighborhood activists have long complained about problems affecting their communities. Dozens of cities have stepped up efforts to address racial inequities in the wake of the police shootings of George Floyd, Breanna Taylor and many other Black people.
Residents in some cities remain skeptical, both about cities’ long-term commitment to addressing equity and about whether better mapping tools will lead to real change.
Forging relationships
The Greenlink Equity Map isn’t meant to stand alone, Duckworth stressed. Instead, the tool aims to help city governments and grassroots groups forge relationships. Then stakeholders can address equity issues related to climate change, sustainability, health, housing and more.
Along those lines, the Greenlink Equity Map has helped parties in Cleveland develop a “shared language” on community issues, Sridhar said. For example, residents in some neighborhoods may notice problems. However, city officials or other policymakers may have brushed off their complaints if people didn’t provide data to show that an issue affects others.
Conversely, data may point to problems in other areas where local groups may not have been as vocal with complaints. Community organizers can then canvas people in those areas to find out what they’ve experienced, Duckworth said.
Either way, neighborhood groups still need stories about people’s experiences to persuade policymakers to help, Cox stressed. “It’s always grounding to remember that these are people’s lives,” he said.
Community-based organizations that meet certain eligibility criteria can access the GEM mapping platform without charge. Employees of leadership cities signed up for the platform also can get access. Other groups can contact Greenlink Analytics to learn about subscription options.
Catch more news at Great Lakes Now:
Mapping the Great Lakes: Power up
Storms strain Ohio’s electric grid, and climate change could make it worse
Featured image: A screenshot from the GEM platform illustrates utility burdens and asthma rates in Cleveland, with the darkest areas representing neighborhoods with both higher energy burdens and higher asthma rates. (Photo Credit: Courtesy via Energy News Network)